Disclaimer
Description
Ever stared at a form’s data and felt like you’re trying to decipher ancient hieroglyphics? We’ve all been there. Sifting through endless entries, desperately seeking a trend, a pattern, anything to make sense of the chaos. But what if you could transform that data into something visually engaging, insightful, and dare we say, even…beautiful? Enter ChartFlow Trend Add-On, the plugin that takes your form data and turns it into stunning trend charts, so clear, even your boss will understand them.
This isn’t just about pretty pictures; it’s about unlocking the hidden stories within your data. Imagine being able to instantly spot peaks in customer satisfaction, identify the most popular product features, or track the effectiveness of your marketing campaigns, all at a glance. No more endless spreadsheets, no more mind-numbing calculations, just pure, unadulterated data visualization that empowers you to make smarter, faster decisions.
With ChartFlow Trend Add-On, you’re not just visualizing data; you’re visualizing success. Prepare to ditch the data drudgery and embrace a world where insights flow freely and decisions are driven by clarity. Because let’s face it, nobody has time for hieroglyphics anymore.
Unleashing the Power of Data Visualization
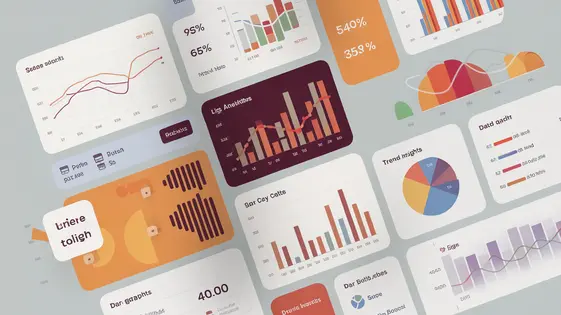
Data visualization transforms raw figures into easily digestible insights. Complex datasets, when presented in tabular form, are often challenging to interpret. Spotting trends and deriving actionable intelligence becomes a tedious, time-consuming task. Charts offer a visual shortcut. Bar graphs, pie charts, line graphs, and scatter plots are just a few examples. They each have their own way to expose underlying data patterns.
Understanding data trends is crucial for making informed decisions. These trends might reveal growth patterns, seasonal fluctuations, or correlations between different variables. Without effective visualization, these trends often remain hidden within the data’s complexity. The ChartFlow Trend Add-On directly addresses this challenge. It empowers you to create compelling, insightful visualizations. Using ChartFlow Trend Add-On, you can create compelling visuals from your forms.
Feature Deep Dive: ChartFlow Trend Add-On’s Arsenal
The ChartFlow Trend Add-On equips you with a powerful suite of tools to visualize data trends effectively. It offers extensive customization options. Developers can tailor charts to match specific branding guidelines. Choose from various chart types like line, bar, and pie charts. This ensures the best representation for different data sets.
Data filtering is crucial for focusing on relevant information. The add-on lets you filter data based on various criteria. Date ranges and specific data points can be isolated. This allows for in-depth analysis of specific trends.
Data exporting capabilities enhance the add-on’s utility. Export charts in common formats such as PNG, JPG and PDF. These exports can be used in reports, presentations, and other documents. This add-on expands the capabilities of the primary chart creation tool, offering trend analysis features. All configurations will still depend on the main plugin.
Use Cases: Where ChartFlow Trend Add-On Shines
The Trend Add-On unlocks valuable insights across diverse applications. In e-commerce, visualize sales trends, identify product performance, and track revenue growth over time. This helps developers build dashboards that empower clients to make data-driven inventory and marketing decisions. For customer satisfaction, monitor survey responses and feedback trends. Pinpoint areas needing improvement and proactively address concerns. Integrated into project management, the add-on visualizes task completion rates, resource allocation, and project timelines, all powered by the underlying charting capabilities. Observe how project progress evolves and identify potential bottlenecks early. In marketing campaigns, track key performance indicators like click-through rates, conversion rates, and website traffic. Compare campaign performance, optimize strategies, and demonstrate the return on investment. The ability to filter data ensures focused trend analysis. The core ChartFlow’s charting capabilities combined with the Trend Add-On creates a robust solution for any WordPress developer needing trend visualization.
Under the Hood: ChartFlow Trend Add-On for Developers
The ChartFlow Trend Add-On is built with developers in mind. It offers extensive customization and extension capabilities. You’re not limited to pre-defined settings. The add-on’s architecture provides freedom to manipulate both its functionality and underlying data. This ensures the generated charts meet your project’s specific requirements.
Integration is streamlined. The add-on is designed for easy incorporation into existing projects. Its modular structure simplifies modification and enhancement. Developers can tap into a comprehensive set of hooks and filters. These allow you to fine-tune the chart generation process and data handling. Modify existing features or introduce completely new ones. Data extraction and formatting can be fully tailored. The goal is to provide a flexible tool that empowers developers to create powerful and insightful trend visualizations within their applications.
Getting Started: A Quick Guide to Trend Charting
Ready to visualize trends? First, ensure the core ChartFlow plugin is installed. Then, install and activate the Trend Add-On like any other plugin from your plugins page. A new “Trend Chart” option will now appear in the ChartFlow chart creation interface.
To create your first trend chart, navigate to the chart creation area. Select “Trend Chart” as your chart type. Choose the form and fields containing the time-series data you wish to analyze. Configure the date format in settings to match your form’s submission data.
Define which field contains the data you want to track over time. ChartFlow Trend Add-On will automatically group your data according to the time intervals. The data will be plotted against the chosen timeframe. Explore the settings for customization, such as line colors and labels. Then, embed the chart using the provided shortcode.
Analyze your data visually. Look for patterns and outliers. Use the interactive features of the chart, like hovering over points to see the values, for deeper insight.
Final words
So, there you have it. ChartFlow Trend Add-On isn’t just another plugin; it’s your secret weapon for turning mountains of data into actionable insights. Forget drowning in spreadsheets and endless reports. With this add-on, you’re armed with the power to visualize trends, identify patterns, and make data-driven decisions with confidence. Whether you’re tracking e-commerce sales, gauging customer satisfaction, or optimizing marketing campaigns, ChartFlow Trend Add-On provides the clarity you need to stay ahead of the curve.
For developers, the flexibility and extensibility of this add-on are a dream come true. Customize it to fit your specific needs, integrate it seamlessly into your projects, and unleash the full potential of your data. The possibilities are endless. But the real magic lies in its simplicity. You don’t need to be a data scientist to create stunning, insightful charts. ChartFlow Trend Add-On does the heavy lifting, so you can focus on what matters most: understanding your data and driving results.
In a world where data is king, clarity is power. And with ChartFlow Trend Add-On, you’re holding all the cards. So go ahead, transform your data into visual masterpieces, and watch your insights soar. Because when you can see the trends, you can conquer the market. Get it now!
Latest changelog
Changelog
Demo Content
Comments
Request update
About
- 1.2.0
- 2 seconds ago
- April 20, 2025
- View all from author
- Charting Add-on
- GPL v2 or later
- Support Link