Disclaimer
Description
Ever stared at a sea of data and thought, ‘There has to be a better way to visualize this?’ You’re not alone. We’ve all been there, drowning in spreadsheets and longing for something, anything, that can turn those numbers into something digestible. That’s where the GFChart DataView Add-On comes swaggering in, ready to rescue you from data-induced despair.
Think of it as the superhero your forms have been waiting for. This isn’t just another way to display information; it’s about transforming raw entries into compelling charts and graphs that even your least data-inclined clients will understand. Built upon the rock-solid foundation of GFChart, the DataView Add-On takes the already impressive charting capabilities and cranks them up to eleven. We’re talking interactive charts, customizable dashboards, and the kind of data presentation that makes you look like a freakin’ genius.
So, if you’re tired of wrestling with data and ready to unleash its true potential, buckle up. We’re about to dive into how the GFChart DataView Add-On can revolutionize the way you (and your users) interact with information, one beautifully rendered chart at a time. Get ready to ditch the data drudgery and embrace the power of visualization!
Unleash the Power of Visual Data: An Overview
Data visualization is a powerful method. It transforms complex information into easily digestible formats. By representing data visually, patterns and trends become immediately apparent. This clarity is crucial for informed decision-making. Our DataView add-on empowers you to convert form entries into compelling charts and graphs. Forget sifting through endless spreadsheets. Instead, gain rapid insights from interactive visuals.
Visual representations significantly improve user experience. They allow users to grasp key metrics at a glance. This is far more effective than reading through lengthy reports. Our add-on helps enhance presentations and dashboards. You can create informative visuals tailored to specific audiences. The ability to quickly understand data leads to faster and more accurate conclusions. The DataView add-on helps unlock the true potential of your data. It offers a more intuitive and engaging experience. Use it to make data a central asset, not an obstacle.
Chart Types and Customization: Tailoring Visuals to Your Needs
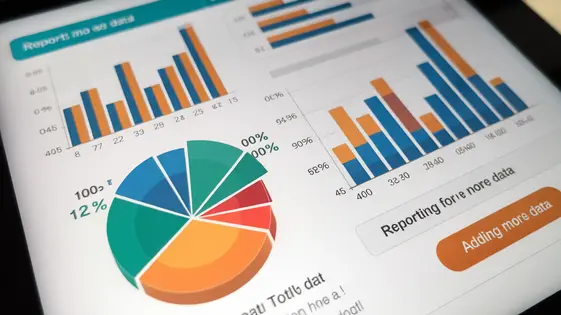
The DataView Add-On provides various chart types to represent your form data effectively. Bar charts are excellent for comparing values across different categories. Pie charts display proportions of a whole. Line graphs illustrate trends over time. Each chart type offers unique customization options.
Colors can be modified to match branding or highlight specific data points. Labels provide context and clarity. Tooltips offer detailed information on hover. Interactive elements, like clickable data points, can enhance user engagement. Choosing the right chart depends on your data and the story you want to tell.
For instance, use a bar chart to compare the number of responses for different form options. A pie chart is suitable to show the percentage breakdown of survey answers. Select a line graph to track changes in form submissions over a period. Thoughtful customization ensures your charts are both informative and visually appealing.
Integration and Display: Seamlessly Embedding Charts
Seamlessly integrate data visualizations into your forms and display them effectively. Charts created with the DataView Add-On can be embedded into posts, pages, or even custom templates with ease. Two primary methods facilitate this: shortcodes and template tags.
Shortcodes offer a simple way to embed charts directly within the content editor. Each chart is assigned a unique shortcode upon creation. Simply copy and paste this shortcode into the desired location on your page or post. The chart will render dynamically when the page is viewed.
For developers requiring more control, template tags provide a programmatic way to embed charts within theme files. Use template tags to output charts within specific areas of your site layout. This gives you flexibility to integrate charts deeply into the design.
Optimize chart placement by considering the surrounding content. Ensure the chart complements the information being presented. Responsiveness is also key. Make sure your charts adapt seamlessly to different screen sizes. Use CSS media queries or responsive chart options, if available, to guarantee an optimal viewing experience on all devices.
Advanced Features: Interactive Filters and Data Drill-Down
The DataView Add-On extends data exploration with interactive filters and drill-down capabilities. These empower users to dynamically analyze data and uncover deeper insights beyond static chart representations. Interactive filters allow users to selectively display subsets of data based on specific criteria. Implement these filters directly within the chart’s settings. For example, create a dropdown filter to view sales data by region. Another example is a date range selector to analyze trends within specific periods. These filters instantly update the chart, offering immediate feedback and facilitating focused analysis.
Data drill-down takes exploration a step further. Clicking on a chart element, such as a bar in a bar chart, reveals more granular data related to that element. Configure drill-down actions to display detailed records or even link to other charts providing contextual information. This feature transforms charts from static visuals into dynamic data portals. Dynamic updates ensure that charts reflect the latest data in real-time. Implement this feature through scheduled data refreshes, guaranteeing users always see the most current information. These advanced features turn your data into an interactive and insightful resource.
Troubleshooting and Best Practices: Ensuring Optimal Performance
Even with careful setup, issues can sometimes arise. Chart rendering delays often stem from large datasets. Limit the data displayed initially using date range filters or data aggregation. Leverage calculated fields within your forms to pre-process data, reducing the load on the charting engine. Confirm your server meets minimum requirements for memory and processing power.
Theme and plugin conflicts can also cause problems. Try temporarily deactivating other plugins to isolate the source. If a theme is the culprit, consider using a default theme for the specific page displaying the chart. Review browser console errors for clues about javascript conflicts. Regularly update the core forms plugin and the charting add-on to benefit from bug fixes and performance improvements. When experiencing unexpected results, double-check your field mappings and calculation formulas. Verify that the data types match the expected inputs for each chart element. For instance, ensure numerical fields are used for numerical axes. Clear your browser cache to eliminate outdated script or style issues.
Final words
The GFChart DataView Add-On isn’t just another tool; it’s a gateway to understanding your data in a way that spreadsheets simply can’t provide. By transforming complex information into visually engaging charts and graphs, you empower yourself and your audience to make informed decisions with confidence. We’ve explored the core features, from basic chart creation to advanced interactive filters, and hopefully, you’re now armed with the knowledge to unlock the full potential of your form data.
Remember, data visualization isn’t about making things look pretty (though it certainly does that); it’s about clarity, insight, and action. With the GFChart DataView Add-On, you can transform raw numbers into compelling stories, revealing trends and patterns that would otherwise remain hidden. Whether you’re tracking sales, analyzing survey responses, or monitoring website traffic, this add-on provides the tools you need to communicate your findings effectively.
So, go forth and visualize! Experiment with different chart types, customize your displays, and discover the power of visual data. The GFChart DataView Add-On is your secret weapon for turning data into actionable intelligence, making you the hero of your next presentation or the mastermind behind your company’s success. The ability to quickly and effectively communicate insights derived from your data is more crucial than ever. Embrace it, and watch your data come to life.
Latest changelog
Changelog
Demo Content
Comments
Request update
About
- 0.10.3
- 2 seconds ago
- April 20, 2025
- GFChart™
- View all from author
- Chart Add-on
- GPL v2 or later
- Support Link