Disclaimer
Description
Ever feel like your project management plugin is great at managing but terrible at, you know, showing you what’s actually going on? Do you long for insightful reports that don’t require a PhD in data science to decipher? Well, buckle up, buttercup, because UpTrack Reporting is here to save the day! This isn’t your grandpa’s dusty spreadsheet generator. We’re talking visually appealing, easily digestible reports that transform raw project data into actionable insights. Forget endless meetings trying to figure out where your projects stand. UpTrack Reporting takes the chaos and turns it into clarity. Think of it as having a crystal ball for your project timelines, but instead of vague prophecies, you get hard data and beautiful charts. No more guessing, just data-driven decisions. Ready to ditch the guesswork and embrace the power of project insights? Let’s dive in and see how UpTrack Reporting can turn your project management woes into project success stories.
Unlock Data-Driven Decisions with Project Reporting
Accurate and easily understandable reports are crucial for making informed decisions. Project reporting empowers users to leverage data and insights. It aids in identifying trends, potential bottlenecks, and areas needing improvement. This leads to better project management outcomes.
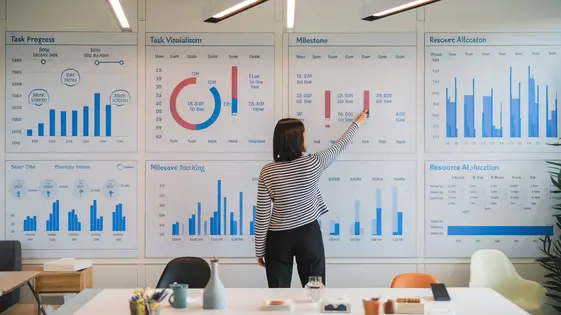
Task progress reports provide a clear overview of project execution. They allow for quick assessment of task completion rates. Milestone completion reports offer insights into schedule adherence. Resource allocation reports show how resources are being utilized across projects. Examining these reports helps to optimize resource distribution. For example, a resource allocation report might reveal an over-allocation, prompting a reassignment for balanced workloads.
Identifying bottlenecks becomes easier with visual reports. A report showing stalled tasks can quickly flag areas where intervention is needed. These insights translate into proactive adjustments, ensuring projects stay on track. Data-driven decisions lead to more efficient resource management, reduced risks, and improved project success rates.
Master Task Progress Tracking for Project Success
Effective task progress tracking is vital for project success. Our reporting system allows you to meticulously monitor individual task statuses. You can also see the overall project advancement at a glance. We use diverse metrics and visualizations to represent progress. These include intuitive charts, informative graphs, and clear progress bars.
This information empowers project managers to proactively identify potential delays. They can also address roadblocks before they impact the timeline. By closely observing task completion rates, resource allocation, and dependencies, you gain actionable insights. You can swiftly adjust strategies and reallocate resources as needed.
Leverage the system to refine your task management. Regularly review task progress reports to pinpoint bottlenecks. Encourage team members to update task statuses frequently. This ensures data accuracy and enables timely interventions. Use the visual cues to communicate project status to stakeholders effectively. Consistent monitoring fosters accountability and drives projects toward successful completion.
Seamless Milestone Management: Achieving Goals on Schedule
Milestones are key checkpoints in any project. They break down large projects into manageable segments. Using project tools, you can easily set milestones, track their completion, and monitor their impact on the project timeline. This involves defining each milestone with clear goals and deadlines.
Visualizing milestone progress is crucial. Progress bars and charts offer quick snapshots of where the project stands. They show what has been achieved and what remains. The system can also alert you to potential delays. Early warnings allow you to take corrective action before issues escalate. This keeps your project on track.
Consider a marketing campaign. Milestones could include completing the market research, finalizing the creative assets, and launching the campaign. Tracking each milestone helps ensure a timely launch. When milestones are met, it creates a sense of accomplishment. This boosts team morale and keeps everyone motivated. Successfully managed milestones lead to successful projects. These ensure that projects remain on schedule and within scope.
Optimize Resource Allocation for Maximum Efficiency
Effective resource allocation is essential for project success. Our reporting tools help you track how resources are used across all projects. This lets you identify both over-allocation and under-allocation. Over-allocation leads to burnout and delays. Under-allocation means resources aren’t being used productively. Our reporting features show you the workload of each team member. You can also see individual and team performance. This insight lets you balance workloads effectively. Move tasks to team members with available capacity. Identify bottlenecks hindering progress. View real-time data on task assignments and completion rates. Address potential problems before they impact deadlines. Maximize resource productivity by matching the right skills to the right tasks. This process ensures that every team member contributes effectively. Balancing workloads also prevents delays. Achieve greater efficiency with informed decision-making based on precise data.
Customizing Reports: Tailoring Insights to Your Needs
UpTrack Reporting empowers you to take control of your project data. You can create reports that precisely match your specific needs. This chapter details the customization options that are available to you.
Filtering lets you focus on key data points. Select specific date ranges to analyze trends over time. Filter by project area to understand performance in different departments. Use these filters in combination to get granular insights.
Sorting allows you to prioritize information. Sort tasks by due date to identify potential delays. Arrange costs by value to highlight significant expenditures. Sorting reveals patterns that would otherwise be hidden.
Formatting options enhance readability. Adjust the layout to emphasize critical information. Use different chart types to visualize data effectively. Ensure your reports are easy to understand at a glance.
Creating custom reports is straightforward. First, select your desired data source. Next, apply filters and sorting rules. Then, choose your preferred formatting options. Save your customized report for future use. Now you can focus on the data that matters most. Each report can be tailored to deliver the insights you need.
Final words
So, there you have it! UpTrack Reporting isn’t just another plugin; it’s your new secret weapon for project success. By transforming your project data into clear, actionable reports, you’ll be able to make smarter decisions, stay on top of tasks, manage milestones effectively, and optimize resource allocation like a pro. No more flying blind or relying on gut feelings. UpTrack Reporting empowers you to take control of your projects with confidence. This tool bridges the gap between raw data and actionable insights, giving you the competitive edge you need to thrive. It’s about working smarter, not harder. And let’s be honest, who doesn’t want that? This is about making your life easier, your projects smoother, and your results more impressive. The ability to tailor your reports to specific needs is paramount, it allows to focus on the data that truly matters to you. By embracing UpTrack Reporting, you’re not just investing in a plugin; you’re investing in your project’s success. Now go forth and conquer your projects with the power of data on your side!
Latest changelog
Changelog
Demo Content
Comments
Request update
About
- 1.3.2
- 2 seconds ago
- April 20, 2025
- UpStream™
- View all from author
- Project Management Add-on
- GPL v2 or later
- Support Link